
Django’s Object-Relational Mapper (ORM) is celebrated for its expressiveness and declarative models. With simple Python syntax like Order.objects.filter(status='paid').select_related('customer'), developers can compose complex database queries without writing raw SQL.
However, ORM abstractions can easily hide performance pitfalls. A missing select_related() or prefetch_related() call can trigger the notorious N+1 query problem, turning a single web page render into hundreds of round-trip database queries. Furthermore, complex annotations and Q-object filters can produce convoluted SQL subqueries that miss database indexes entirely.
In this guide, we explore how to capture raw SQL generated by Django ORM, inspect execution plans, and debug database performance visually using native macOS tooling.
1. Extracting Raw SQL from Django QuerySets
Before debugging a query in a database GUI, you need to see the exact SQL statement Django compiles.
Method A: Inspecting the .query Attribute
In the Django shell (python manage.py shell):
from myapp.models import Order

qs = Order.objects.filter(status='completed', total_amount__gte=100)
print(qs.query)
Output:
SELECT "orders"."id", "orders"."customer_id", "orders"."total_amount", "orders"."status"
FROM "orders"
WHERE ("orders"."status" = 'completed' AND "orders"."total_amount" >= 100)
[!NOTE]
qs.queryonly works onQuerySetobjects (SELECTqueries). It does not work on raw.create(),.update(), or.delete()operations.
Method B: Logging All Generated SQL via Django Settings
To inspect every query your Django backend executes during development, configure the database logger in settings.py:
LOGGING = {
    'version': 1,
    'disable_existing_loggers': False,
    'handlers': {
        'console': {
            'level': 'DEBUG',
            'class': 'logging.StreamHandler',
        },
    },
    'loggers': {
        'django.db.backends': {
            'level': 'DEBUG',
            'handlers': ['console'],
        },
    },
}
2. Diagnosing Django N+1 Query Bottlenecks
The most common Django performance bug occurs when accessing related models inside a loop:
# BUG: Generates 1 query for orders, plus 50 separate queries for customers!
orders = Order.objects.all()[:50]
for order in orders:
    print(order.customer.email)  # Triggers a query on every iteration!
The Fix:
# OPTIMIZED: Performs an SQL INNER JOIN in a single query
orders = Order.objects.select_related('customer')[:50]
3. Profiling Execution Plans with SQLOZ OzExplain (macOS Native)
Once you have extracted the generated SQL query, pasting it into SQLOZ allows you to analyze its execution mechanics instantly.
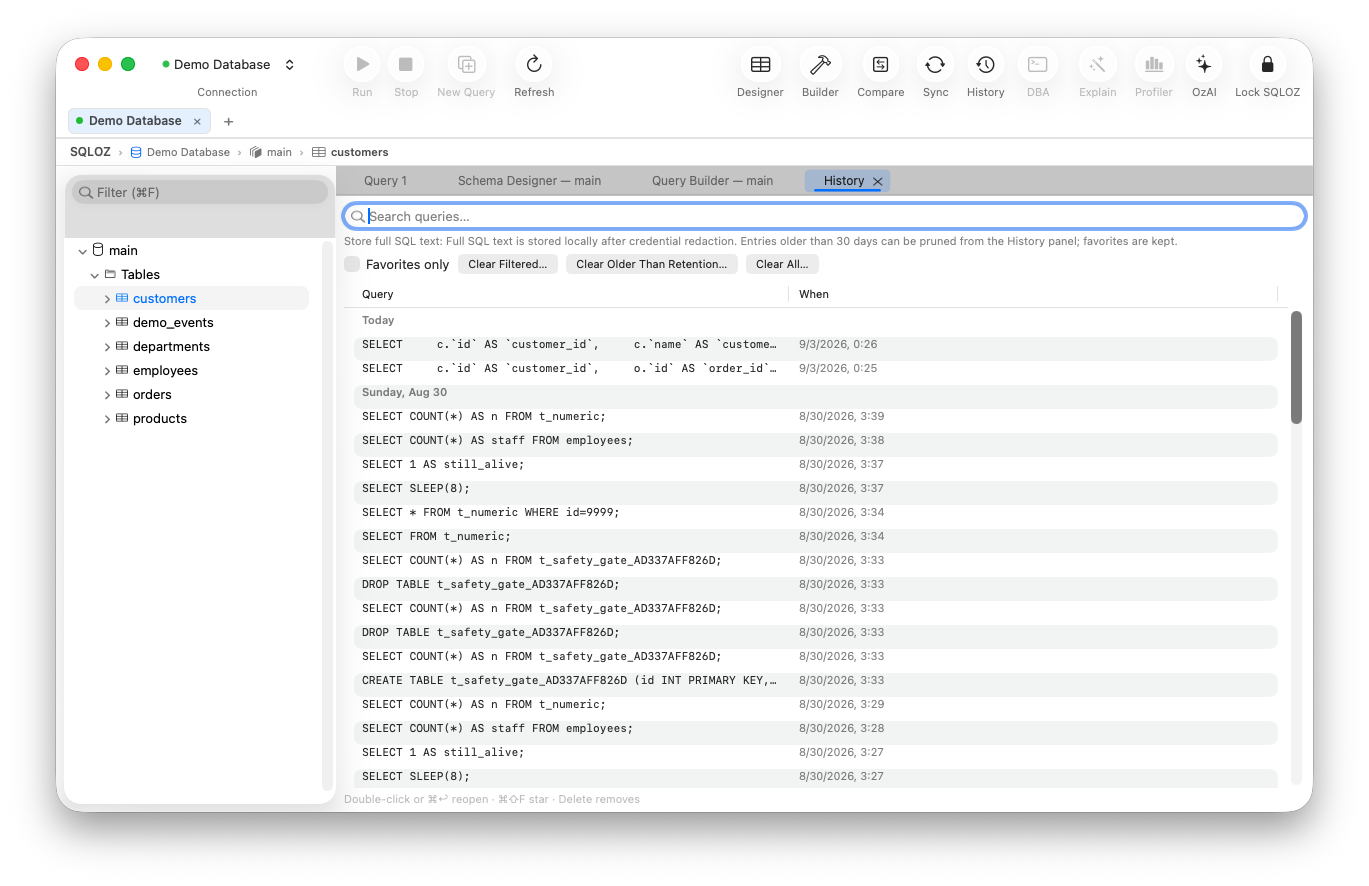
What SQLOZ Delivers for Django Developers:
- Interactive Visual EXPLAIN Tree (OzExplain): In PostgreSQL and MySQL, running
EXPLAIN ANALYZEoutputs dense textual logs. SQLOZ parses this data into a visual cost tree, highlighting Sequential Table Scans in red and showing exactly where Django’s generated query missed an index. - Missing Index Detection: If Django generated a complex filter on multiple annotated fields, SQLOZ suggests the precise composite index definition needed to achieve sub-millisecond execution.
- Inspect Django Local SQLite Files: Django defaults to
db.sqlite3for local prototyping. Drag yourdb.sqlite3file directly into SQLOZ to inspect tables, alter data, or debug migration states without starting the Django server.
4. Migrating Django from SQLite to Production PostgreSQL
When transitioning your Django application from local development to production, migrating data from db.sqlite3 to remote PostgreSQL can be challenging. Standard python manage.py dumpdata often fails due to foreign key circular dependencies or UTF-8 encoding errors.
Using SQLOZ’s integrated Cross-Dialect Migration Tool, you can stream your local Django SQLite database directly into AWS RDS or DigitalOcean PostgreSQL in one click. SQLOZ handles type casting, foreign keys, and sequence resets automatically.
Summary
Django’s ORM is a powerful accelerator, but peak production performance requires inspecting the SQL under the hood. By capturing generated queries and diagnosing execution plans in native tools like SQLOZ, you can eliminate N+1 traps and keep your Django applications blazing fast.
To learn more about Django migrations and performance tuning, read our tutorial on Converting Django SQLite to PostgreSQL with Native GUIs and explore How to Inspect Indexes to Optimize Slow SQL Queries.