
It is the classic production incident: an unindexed analytical query or an uncommitted transaction holds an exclusive lock on a core business table. Within minutes, incoming web application requests queue up, connection pools exhaust their max limits, and API response times spike from 20 milliseconds to complete HTTP 504 Gateway Timeouts.
When your database CPU hits 100%, you need to identify the rogue thread immediately, understand the lock dependency tree, and terminate the offending process without corrupting transactional integrity.
In this guide, we cover CLI commands for troubleshooting active queries in MySQL and PostgreSQL, evaluate the risks of forceful termination, and demonstrate how to manage thread locks visually in native macOS tools.
1. Finding and Killing Stuck Queries in MySQL
In MySQL, all active client connections and running statements are managed via connection threads.
Step 1: Inspecting Running Threads
-- View all running threads across all users
SHOW FULL PROCESSLIST;

-- Or query the Performance Schema for detailed metrics:
SELECT
    id,
    user,
    host,
    db,
    command,
    time AS elapsed_seconds,
    state,
    info AS running_sql
FROM information_schema.processlist
WHERE command != 'Sleep'
  AND time > 5
ORDER BY time DESC;
Critical Process States to Watch:
Sending data: The query is reading rows from the storage engine and evaluating filters. If time is high, the query is likely missing an index.Waiting for table metadata lock: Another thread is performing a DDL operation (e.g.,ALTER TABLEorOPTIMIZE) or has an open uncommitted transaction preventing schema access.Locked: The thread is blocked waiting for another session to release a table-level lock.
Step 2: Terminating the MySQL Thread
-- Terminate query execution while keeping the client connection alive:
KILL QUERY 48291;

-- Force-terminate the entire client connection and rollback its active transaction:
KILL 48291;
[!WARNING] If a long-running
UPDATEorDELETEstatement has modified millions of rows before being killed, MySQL must execute a rollback via the InnoDB undo log. Do not restart the server process while the thread state showsRolling back, as doing so will force an extended crash recovery on startup.
2. Finding and Killing Stuck Queries in PostgreSQL
PostgreSQL treats each client connection as an isolated backend process rather than a thread.
Step 1: Inspecting pg_stat_activity
SELECT
    pid,
    usename,
    client_addr,
    application_name,
    state,
    wait_event_type,
    wait_event,
    NOW() - query_start AS duration,
    query
FROM pg_stat_activity
WHERE state != 'idle'
  AND pid != pg_backend_pid()
ORDER BY duration DESC;
Step 2: Graceful Cancel vs. Forceful Terminate
PostgreSQL provides two built-in administrative functions for killing queries:
-- 1. Graceful Cancellation (Sends SIGINT to cancel the running statement only)
SELECT pg_cancel_backend(18492);

-- 2. Forceful Termination (Sends SIGTERM to sever the backend connection immediately)
SELECT pg_terminate_backend(18492);
Always attempt pg_cancel_backend() first. If the process is stuck in an un-interruptible I/O wait or fails to respond within 15 seconds, escalate to pg_terminate_backend().
3. Diagnosing Lock Deadlocks: The Blocker vs. Victim Tree
Often, the query consuming 100% CPU is not the root cause. The true culprit is frequently an idle in transaction session that acquired an exclusive lock hours ago and was never closed by the application server.
Identifying the Blocker in PostgreSQL:
SELECT
    blocked_locks.pid     AS blocked_pid,
    blocked_activity.usename  AS blocked_user,
    blocking_locks.pid    AS blocking_pid,
    blocking_activity.usename AS blocking_user,
    blocked_activity.query    AS blocked_statement,
    blocking_activity.query   AS blocking_statement
FROM  pg_catalog.pg_locks         blocked_locks
JOIN pg_catalog.pg_stat_activity blocked_activity ON blocked_activity.pid = blocked_locks.pid
JOIN pg_catalog.pg_locks         blocking_locks
    ON blocking_locks.locktype = blocked_locks.locktype
    AND blocking_locks.database IS NOT DISTINCT FROM blocked_locks.database
    AND blocking_locks.relation IS NOT DISTINCT FROM blocked_locks.relation
    AND blocking_locks.page IS NOT DISTINCT FROM blocked_locks.page
    AND blocking_locks.tuple IS NOT DISTINCT FROM blocked_locks.tuple
    AND blocking_locks.virtualxid IS NOT DISTINCT FROM blocked_locks.virtualxid
    AND blocking_locks.transactionid IS NOT DISTINCT FROM blocked_locks.transactionid
    AND blocking_locks.classid IS NOT DISTINCT FROM blocked_locks.classid
    AND blocking_locks.objid IS NOT DISTINCT FROM blocked_locks.objid
    AND blocking_locks.objsubid IS NOT DISTINCT FROM blocked_locks.objsubid
    AND blocking_locks.pid != blocked_locks.pid
JOIN pg_catalog.pg_stat_activity blocking_activity ON blocking_activity.pid = blocking_locks.pid
WHERE NOT blocked_locks.granted;
4. Visual Process Management with SQLOZ DBA Suite (macOS)
Navigating multi-line process tables and complex lock joins during a high-severity production outage adds unnecessary stress.
SQLOZ includes an integrated Processlist & Lock Tree dashboard designed specifically for emergency troubleshooting on macOS.
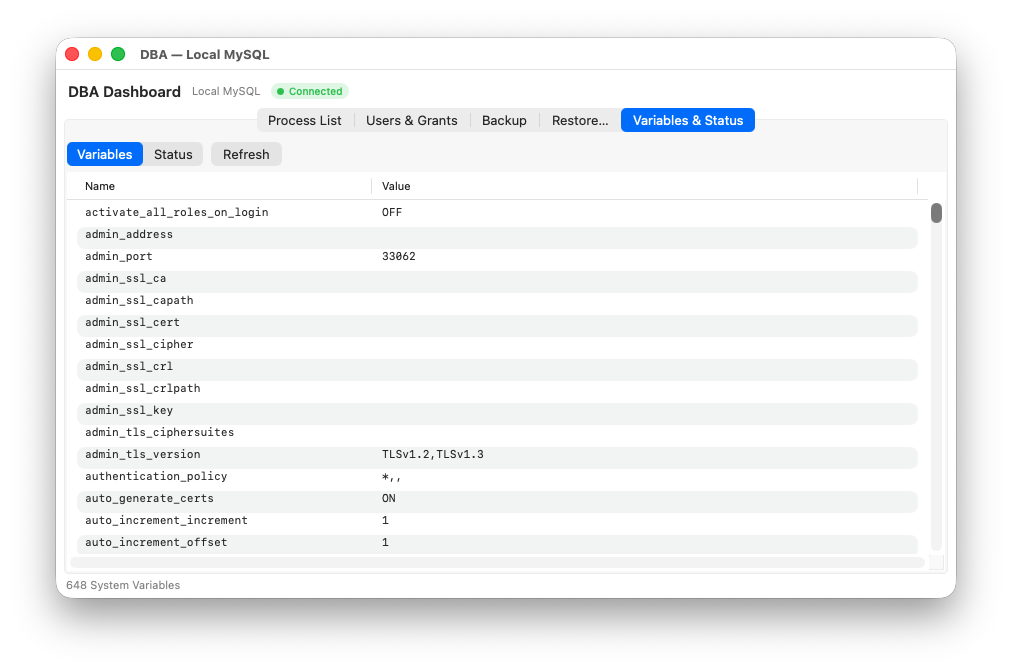
Features of SQLOZ Process Management:
- Live Auto-Refresh: Continuously monitors server threads with sub-second polling without impacting server performance.
- Visual Lock Dependency Tree (OzLockTree): Automatically builds a hierarchical visual diagram showing the root blocking session at the top and cascading blocked queries underneath.
- One-Click Safe Kill: Kill individual queries (
KILL QUERY) or terminate connections with a single click, complete with transaction status confirmation. - Memory & Latency Meters: Displays real-time thread CPU consumption, temporary table disk usage, and query start durations.
Summary
When queries freeze production databases, rapid diagnostic speed is critical. By keeping standard processlist queries handy or leveraging the native visual dashboards in SQLOZ, engineering teams can resolve bottlenecks in seconds and keep their applications running smoothly.
To learn more about optimizing slow database workloads, read our tutorial on How to Inspect Indexes and Optimize Slow SQL Queries and discover How to Safely Run UPDATE and DELETE Statements Without Crashing Production.