
Writing SQL by hand is a superpower, but for multi-table analytical queries, it frequently feels like navigating a minefield. One forgotten JOIN predicate triggers an inadvertent Cartesian product (CROSS JOIN). A misplaced parenthesis in a nested AND/OR filter silently corrupts your business logic. And if you are exploring an unfamiliar relational database with dozens of foreign keys, typing out repetitive boilerplate SELECT and JOIN clauses drains hours of productivity.
Whether you are a data analyst, product manager, backend engineer, or founder, the question arises: Can you build production-ready, complex SQL queries visually without writing code?
The answer in 2026 is an emphatic yes - provided you have the right tool. In this hands-on guide, we explore how to visually model relational queries, master multi-table JOINs with visual canvas tools, and examine why a native macOS visual SQL query builder like SQLOZ outperforms legacy Java and Electron database clients.
1. Why Visual Query Construction Is Replacing Manual SQL Boilerplate
For decades, developers viewed visual SQL generators with skepticism. Older enterprise tools often produced unreadable, unoptimized SQL statements riddled with unnecessary subqueries and non-SARGable functions.
However, modern visual query builders take a completely different approach:
- Instant Schema Exploration: Instead of executing
DESCRIBE tableor hunting through database documentation, you drag tables onto an interactive canvas and instantly see column types, primary keys, and foreign relationships. - Zero Syntax Errors: Typos in table names, missing commas, or mismatched quotes vanish. The visual engine compiles an Abstract Syntax Tree (AST) that guarantees syntactically correct SQL across MySQL, PostgreSQL, SQLite, and MariaDB.
- No-Code Accessibility with Pro-Code Precision: Non-technical stakeholders can build ad-hoc aggregations and customer segments independently, while senior developers can use the visual canvas to prototype complex relational joins before fine-tuning them in an editor.
2. Visual SQL Join Visualizer: Mastering Relationships Without Code
The single biggest roadblock when learning SQL - or building complex reports - is SQL JOIN syntax. Understanding whether to use an INNER JOIN, LEFT JOIN, or FULL OUTER JOIN can be mentally taxing in raw text, but it becomes crystal clear when represented visually.
┌─────────────────────────────────────────────────────────────┐
│                   VISUAL JOIN VISUALIZER                     │
├─────────────────────────────────────────────────────────────┤
│  [customers]                             [orders]           │
│  ┌────────────────┐                      ┌────────────────┐ │
│  │ id (PK)        │──────(LEFT JOIN)────►│ id (PK)        │ │
│  │ first_name     │   customers.id =     │ customer_id(FK)│ │
│  │ email          │   orders.customer_id │ total_amount   │ │
│  └────────────────┘                      │ status         │ │
│                                          └────────────────┘ │
└─────────────────────────────────────────────────────────────┘- INNER JOIN (Overlap): Only returns records where a match exists in both tables (e.g., customers who have placed at least one order).
- LEFT JOIN (All Left + Matching Right): Keeps every single customer on your canvas, appending order information when available and filling missing fields with
NULL(e.g., finding inactive customers who haven’t ordered yet). - RIGHT JOIN / FULL OUTER JOIN: Visual nodes let you flip directionality with a single click, instantly updating the underlying join clause.
In SQLOZ, creating a join requires nothing more than dragging a connector line from a primary key (customers.id) to a foreign key column (orders.customer_id). The application detects the relationship and builds the exact join predicate automatically.
3. Step-by-Step Guide: Building a Multi-Table Query with SQLOZ
Let’s walk through building a real-world e-commerce sales report that joins Customers, Orders, and Order Items, calculates total order spend, and filters for orders completed in the last 30 days.
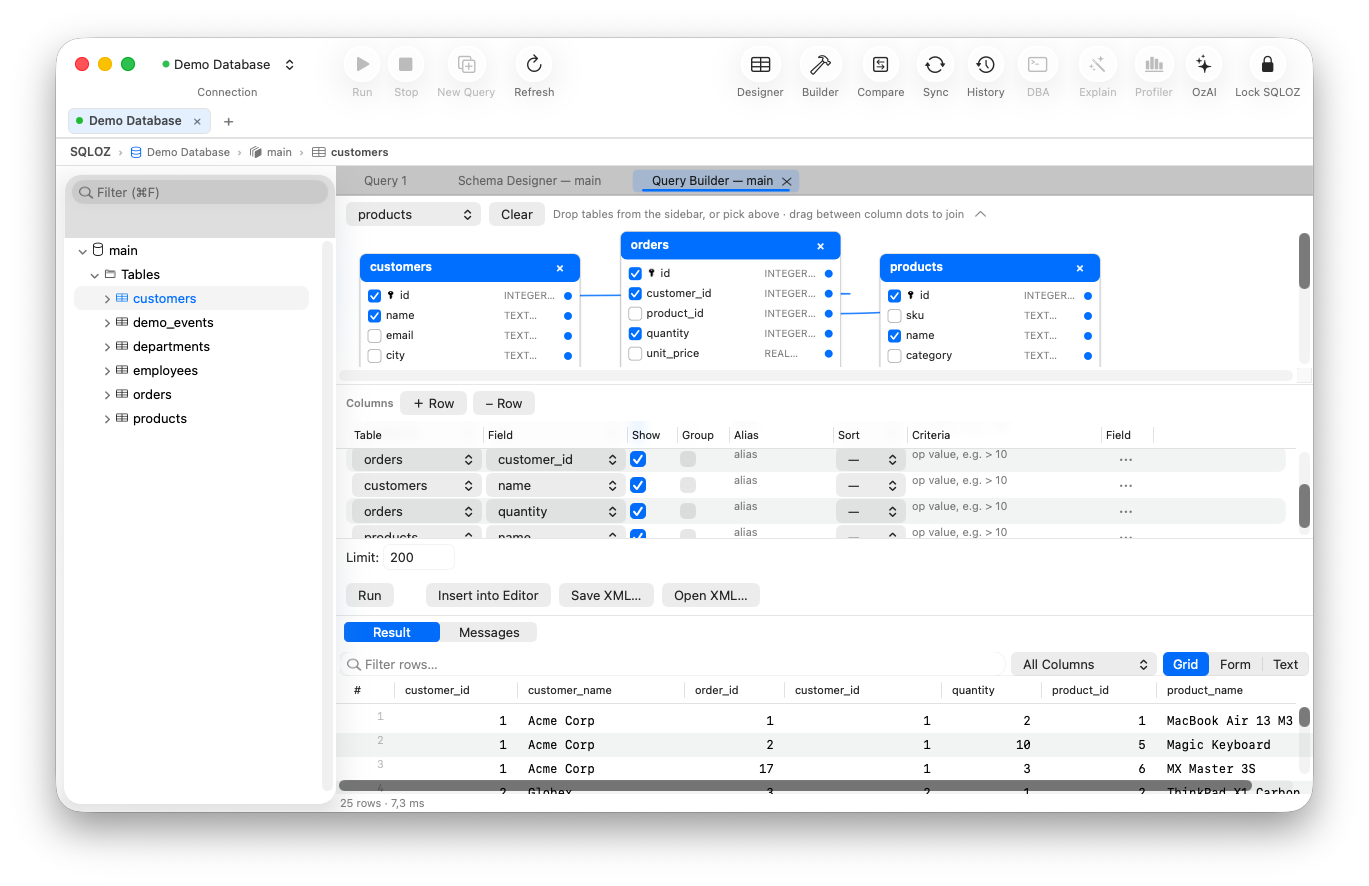
Step 1: Drag & Drop Tables onto the Canvas
Open the Query Builder tab in SQLOZ. From the left sidebar’s Object Browser, simply drag the customers, orders, and order_items tables directly onto the canvas. SQLOZ renders each table as a clean, floating card displaying column names, data types, and key badges.
Step 2: Connect Tables with Smart Relationship Detection
Hover over customers.id and drag a connector arrow to orders.customer_id. SQLOZ immediately recognizes the foreign key relationship and constructs a LEFT JOIN. Repeat the action between orders.id and order_items.order_id. You can click on any connection link to toggle between INNER, LEFT, or RIGHT join modes.
Step 3: Check the Fields You Need
Instead of writing out tedious column aliases:
- Check
customers.first_nameandcustomers.email. - Check
orders.created_atandorders.status. - In the table card, double-click an alias field to rename output columns (e.g.,
customers.email AS customer_email).
Step 4: Add Visual Filters (WHERE & HAVING without Syntax Traps)
In the bottom Conditions panel:
- Click + Add Filter.
- Select
orders.status-> Operator=-> Value'completed'. - Select
orders.total_amount-> Operator>-> Value100. - Group conditions into
ANDorORblocks visually. No more nested bracket errors!
Step 5: Configure Aggregations & Grouping
To calculate total revenue per customer:
- Set the aggregation dropdown next to
orders.total_amountto SUM. - SQLOZ will automatically generate the corresponding
GROUP BY customers.id, customers.first_name, customers.emailclause behind the scenes.
Step 6: Real-Time Live SQL Compilation & One-Click Run
As you manipulate cards on the canvas, the Live SQL Preview panel generates formatted, readable SQL in real time:
SELECT
    c.id AS customer_id,
    c.first_name,
    c.email AS customer_email,
    COUNT(o.id) AS total_orders,
    SUM(o.total_amount) AS lifetime_value
FROM customers c
LEFT JOIN orders o ON c.id = o.customer_id
WHERE o.status = 'completed' AND o.total_amount > 100
GROUP BY c.id, c.first_name, c.email
ORDER BY lifetime_value DESC;
Click Run (⌘R) to stream the results immediately into SQLOZ’s responsive data grid.
4. Visual Query Builder vs. Writing Raw SQL: When to Use Which?
Senior engineers don’t abandon the SQL editor; they choose the most efficient tool for the job. Here is a balanced evaluation of when visual building accelerates workflow vs. when writing raw code is preferred:
| Workflow Scenario | Visual Query Builder | Raw SQL Editor |
|---|---|---|
| Exploring an Unfamiliar Database | Superior: Instantly view relationships and schema without querying information_schema. | Tedious: Requires multiple discovery queries. |
| Multi-Table JOIN Prototyping | Superior: Drag-and-drop connections avoid Cartesian accidents. | Moderate: Easy to miss an ON condition in 5+ table joins. |
| Ad-Hoc Reports & Business Metrics | Superior: Fast column picking and instant aggregation toggles. | Slower: Typing repeated aliases and GROUP BY columns. |
| Recursive CTEs & Hierarchical Data | Limited: Graph traversal logic requires specific custom definitions. | Superior: Direct CTE syntax (WITH RECURSIVE) offers full dialect control. |
| Low-Level Query Engine Tuning | Good for baseline logic; optimizer hints require manual touch. | Superior: Direct injection of engine-specific hints (FORCE INDEX, EXPLAIN ANALYZE). |
The SQLOZ Advantage: You are never locked in. SQLOZ allows you to start your query visually, generate clean SQL with one click, and send it directly into the native SQL Editor or consult the built-in AI SQL Assistant for immediate index recommendations.
5. Top Visual SQL Query Builders for macOS in 2026: The Competitive Landscape
If you are working on a Mac, your choice of database GUI makes a substantial difference in daily battery life, speed, and overall developer experience:
1. SQLOZ (Native macOS - Swift & Apple Silicon Optimized)
- Architecture: 100% Native macOS, written in Swift and Metal. No Java virtual machine, no web browser wrapper.
- Launch Time: Sub-100ms instant startup.
- Memory Footprint: Typically 40MB–80MB RAM.
- Visual Builder: Fluid 120 FPS infinite canvas with automatic foreign key relationship mapping, SARGable filter compilation, and live SQL preview.
- Security: Native macOS Keychain integration for enterprise-grade credential protection.
2. DBeaver (Java / Eclipse RCP)
- Pros: Supports virtually any database via JDBC drivers.
- Cons: Noticeable Java UI lag, high memory consumption (frequently exceeding 1GB+ RAM), and an dated visual query builder that feels clunky on macOS.
3. Navicat
- Pros: Robust enterprise feature set and established visual query design module.
- Cons: High commercial licensing cost, heavyweight resource usage, and non-native macOS interface styling.
4. TablePlus
- Pros: Sleek, lightweight native macOS interface loved for quick inline editing.
- Cons: Lacks a dedicated visual drag-and-drop query builder; users must write manual SQL for relational queries and joins.
6. Summary: Accelerate Your Relational Data Workflows Today
Constructing multi-table SQL queries should not require keeping dozens of schema diagrams in your head or wrestling with manual syntax errors. A modern visual query builder bridges the gap between raw database performance and intuitive, fluid workflow design.
With SQLOZ, Mac users no longer need to choose between heavyweight cross-platform tools and barebones editors. Experience an ultra-fast, native macOS visual query builder that turns complex joins, filters, and aggregations into an intuitive, drag-and-drop workflow.
Ready to visualize your database without writing tedious boilerplate?
Download SQLOZ for macOS and experience the future of visual SQL modeling on Apple Silicon.