
Generating summary reports - such as total revenue by month, average order value per product category, or customer signup counts by country - is the bread and butter of database reporting.
However, in raw SQL, working with aggregate functions (COUNT, SUM, AVG, MIN, MAX) requires strict adherence to the relational standard: every non-aggregated column in your SELECT list must be explicitly declared in the GROUP BY clause.
Forget one column in your GROUP BY clause, and PostgreSQL will reject the query immediately:
ERROR: column "customers.name" must appear in the GROUP BY clause or be used in an aggregate functionMySQL (in non-strict modes) might execute the query, but silently returns arbitrary, non-deterministic values for un-grouped columns, creating flawed business analytics.
In this tutorial, we show you how to generate bulletproof SQL aggregations visually on macOS using SQLOZ.
1. How SQL Aggregations Work
Aggregate functions take a collection of row values and collapse them into a single summary scalar value:
COUNT(*)orCOUNT(id): Tallies total matching records.SUM(column): Calculates the numeric total (e.g., total sales volume).AVG(column): Computes the arithmetic mean (e.g., Average Order Value / AOV).MIN()/MAX(): Finds the earliest/lowest and latest/highest values in a column.
When combined with GROUP BY, the engine groups identical rows together and calculates the aggregate independently for each group.
2. The Visual Aggregation Workflow in SQLOZ
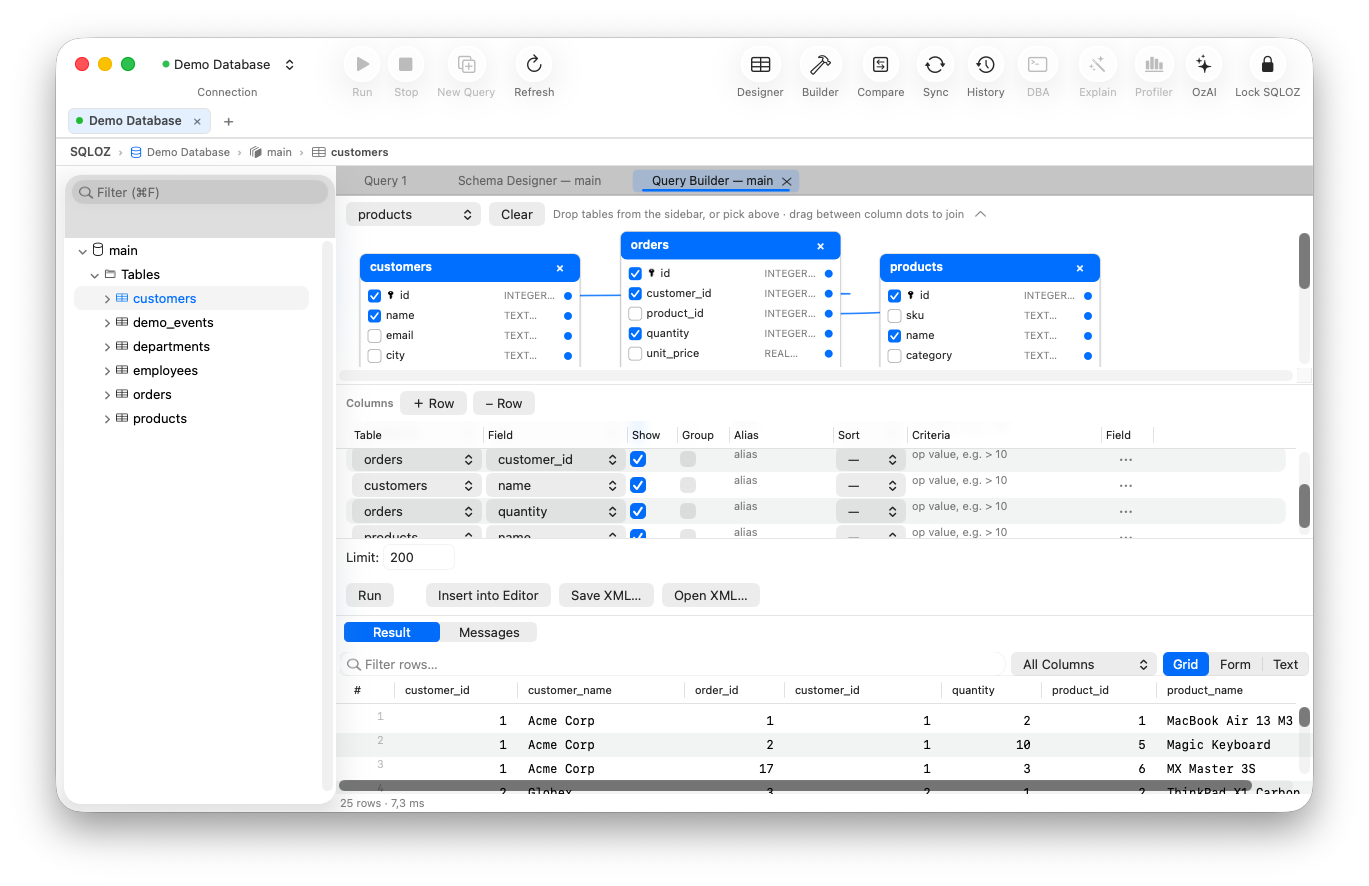
SQLOZ’s Visual Query Builder automates the entire GROUP BY compilation process.
Step 1: Drag Tables onto the Canvas
Open the Query Builder in SQLOZ and drag your source tables onto the canvas (e.g., products, orders, order_items).
Step 2: Select Your Grouping Dimension
Check the columns you want to group by (e.g., products.category and products.name). SQLOZ automatically marks these as grouping dimensions.
Step 3: Apply Visual Aggregations
In the order_items table card:
- Click the dropdown next to
quantityand select SUM (Renamed automatically toSUM(order_items.quantity) AS total_units_sold). - Click the dropdown next to
priceand select AVG (Renamed toAVG(order_items.price) AS average_price). - In the
orderstable card, click the dropdown next toidand select COUNT DISTINCT to calculate unique order count.
Step 4: Live AST SQL Preview
As you select dropdown options, SQLOZ’s internal AST compiler automatically groups all non-aggregated columns and writes clean, standard SQL:
SELECT
    p.category,
    p.name AS product_name,
    COUNT(DISTINCT o.id) AS unique_orders,
    SUM(oi.quantity) AS total_units_sold,
    ROUND(AVG(oi.price), 2) AS average_selling_price
FROM products p
INNER JOIN order_items oi ON p.id = oi.product_id
INNER JOIN orders o ON oi.order_id = o.id
GROUP BY p.category, p.name
ORDER BY total_units_sold DESC;
Zero syntax errors. Zero missing GROUP BY column rejections.
3. Instant Visual Filtering with HAVING
Need to filter the aggregated results (e.g., only show categories with more than 50 total sales)?
- Switch to the HAVING tab in the filter panel.
- Add:
SUM(order_items.quantity) > 50. - Press ⌘R to run the query and view your formatted report in the data grid.
Summary
Calculating metrics and aggregations should be fast and visual.
With SQLOZ, Mac developers and analysts can model complex GROUP BY reports and summary dashboards visually without typing repetitive boilerplate SQL.
Download SQLOZ for macOS and experience visual SQL aggregations on Apple Silicon today.