
As a Product Manager (PM) or Business Analyst, your roadmap decisions rely on data:
- Which features have the highest 30-day user retention?
- How many enterprise customers downgraded their subscriptions last week?
- What is the geographic breakdown of users experiencing checkout errors?
Too often, PMs face an unenviable dilemma: wait 4 days for an overburdened backend engineer to pull a custom CSV, or struggle to write raw SQL joins in a confusing terminal client.
In 2026, you don’t need to learn complex database syntax to pull accurate, verified customer data. In this guide, we show how PMs can query production and staging databases independently using SQLOZ on Mac.
1. The Friction of Traditional Database Access for PMs
When non-technical or semi-technical team members attempt to query databases:
- The Fear of Breaking Production: Running an accidental update or locking tables during peak hours is a legitimate concern.
- Obscure Column Names: Guessing whether user IDs are named
user_id,account_id, oruidacross 4 different tables. - Syntax Complexity: Writing multi-table
JOIN,GROUP BY, and date arithmetic syntax by hand.
2. The No-Code Solution: SQLOZ Visual Query Builder
SQLOZ is a native macOS database client designed with intuitive visual workflows that make querying accessible to anyone.
Step 1: Connect with Read-Only Safety
Ask your DevOps team for a read-only database user or replica connection string. In SQLOZ, assign the connection an Orange Staging or Blue Test badge.
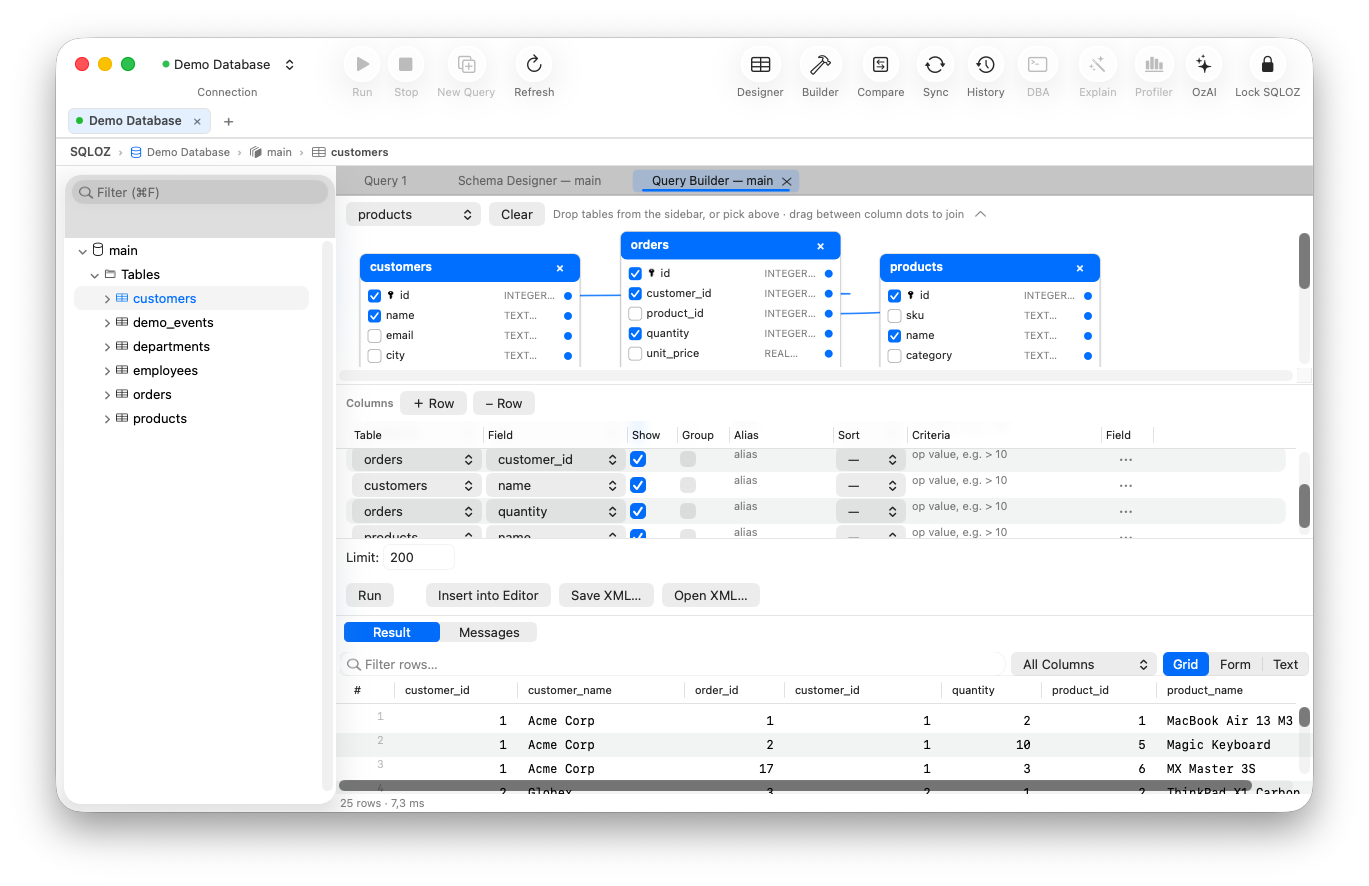
Step 2: Drag & Drop Tables onto the Canvas
Open the Query Builder tab. Drag the tables you want to inspect (e.g., users, subscriptions, invoices) directly from the sidebar onto the canvas.
Step 3: Link Relationships Visually
Hover over users.id and drag a line to subscriptions.user_id. SQLOZ connects them with a clean arrow and handles the join predicate automatically.
Step 4: Pick the Columns You Need
Simply check the boxes next to the fields you care about:
users.emailusers.created_atsubscriptions.plan_tiersubscriptions.monthly_recurring_revenue
Step 5: Filter with Visual Pills
Click + Add Condition:
- Select
subscriptions.status➔ Operator:=➔ Value:'active'. - Select
subscriptions.plan_tier➔ Operator:=➔ Value:'pro'.
Step 6: Run and Export to Excel / CSV
Click Run (⌘R). Your filtered customer cohort appears instantly in the responsive data grid. Click Export ➔ CSV to open the records directly in Microsoft Excel, Google Sheets, or Notion.
3. Built-In Safety Guards
To protect production infrastructure:
- SQLOZ’s Safety Gate blocks write queries on read-only sessions.
- Keyset pagination limits result sets automatically so you never accidentally crash a server with an unconstrained billion-row scan.
Summary
Data-driven decision making shouldn’t require waiting on engineering tickets.
With SQLOZ, Product Managers gain the independence to explore user data, model multi-table cohorts, and export reports in seconds without writing a single line of SQL.
Download SQLOZ for macOS and take control of your product analytics today.